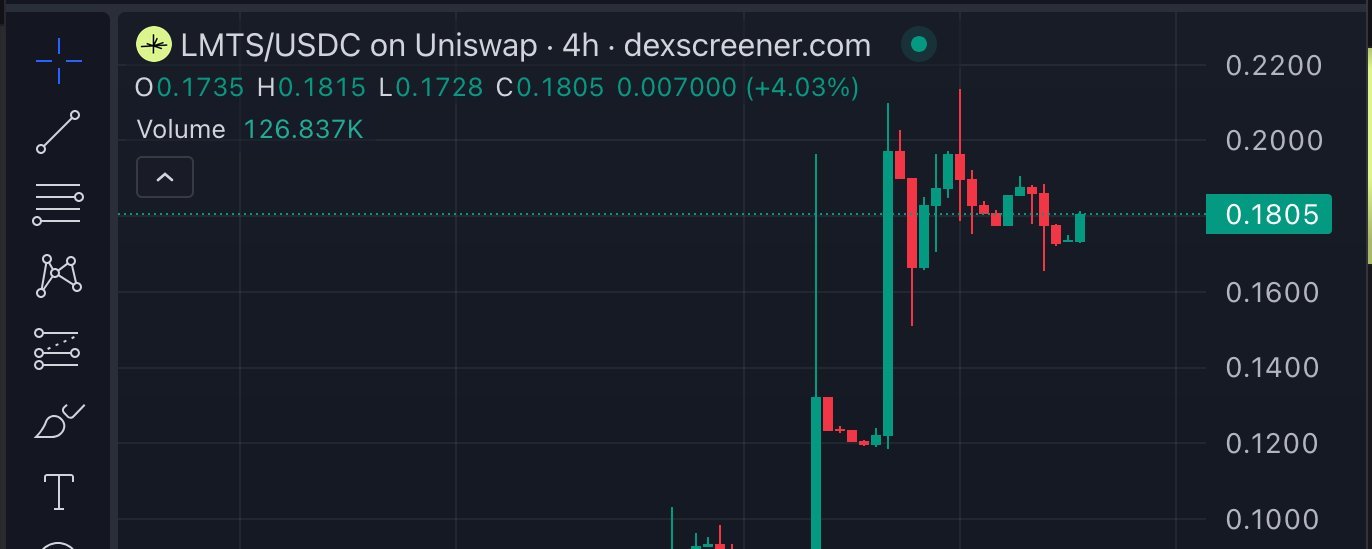
LMTS went from $0.08 to $0.18 in nine days. A 125% move. Everyone holding is feeling great right now.
But what does the liquidity underneath actually look like?
We built a Dune dashboard that stress-tests individual Uni V3 pools, it measures what actually happens to price when selling pressure hits a single pool, compared against what would happen if the same TVL were spread across full range. We ran it on the USDC/LMTS Uniswap pool at $0.08, then again at $0.18 after the pump.
It's not pretty.
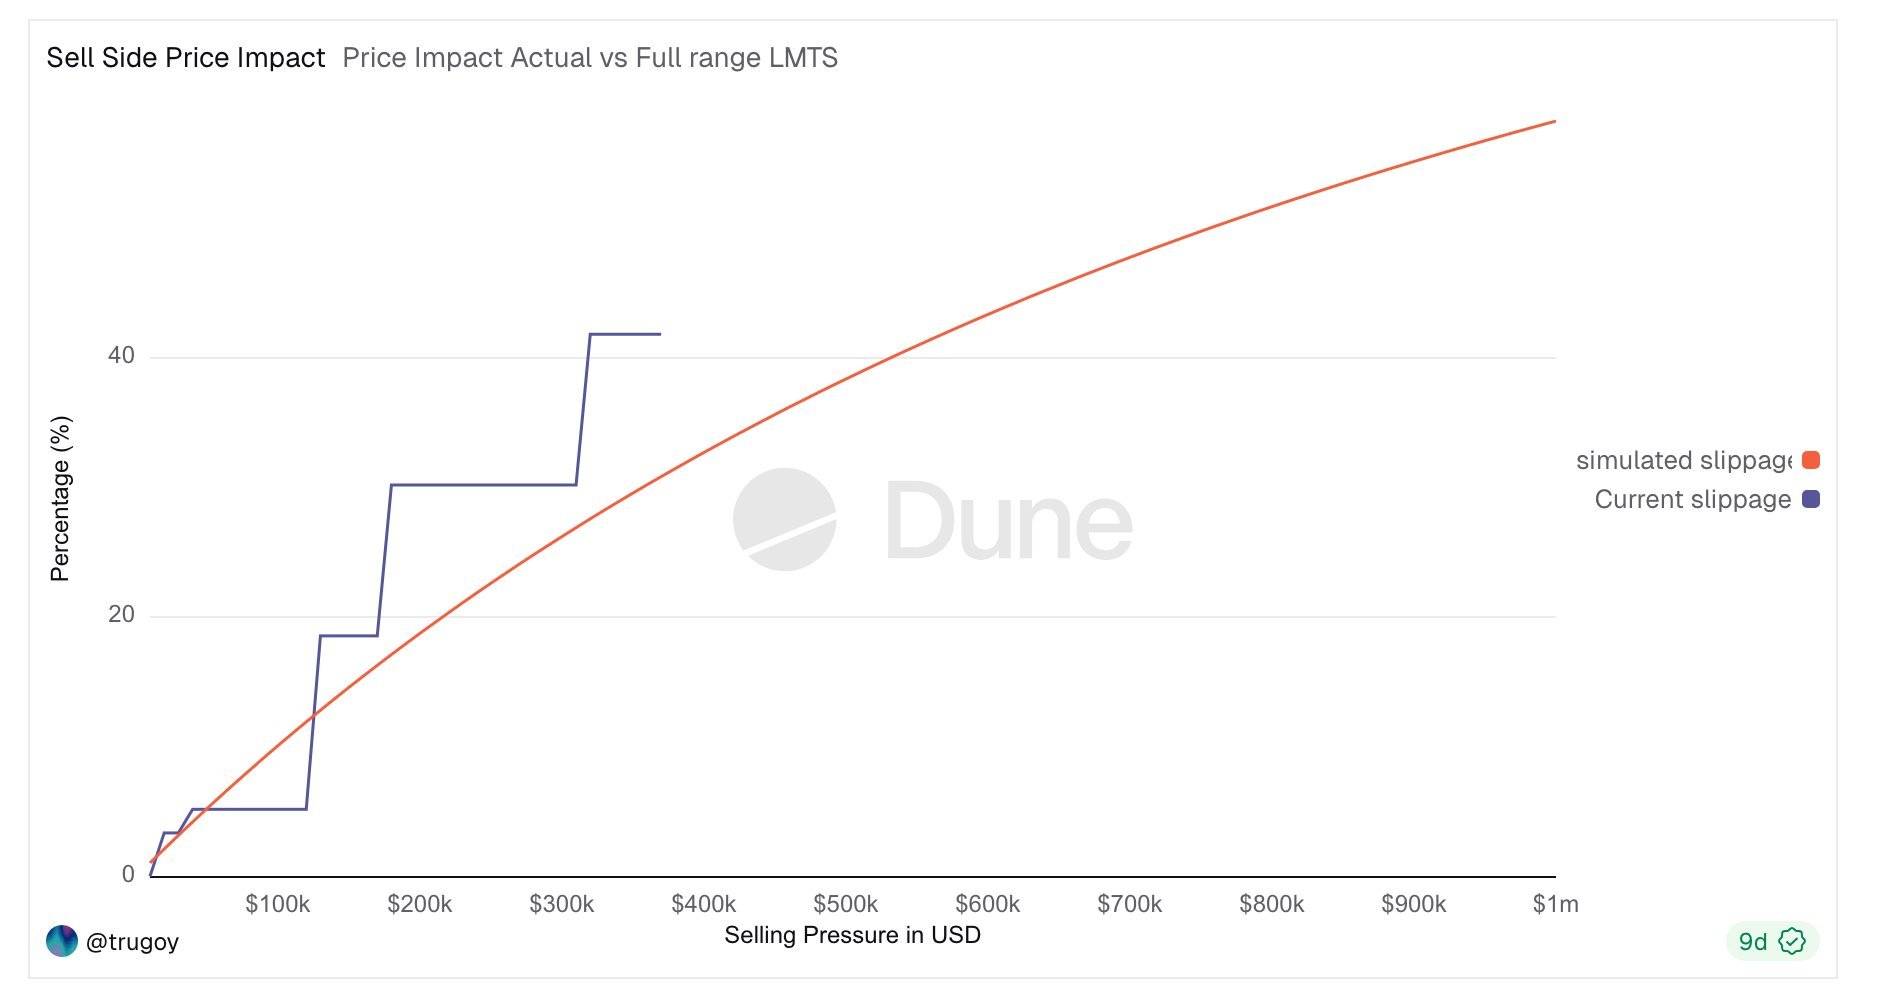
Selling got way harder
At $0.08, dumping $100k of LMTS cost about 5% in slippage. The actual pool slippage roughly tracked the simulated full-range curve.
After the 125% pump? That same $100k sell now costs ~20% in slippage. Try to sell $250k and you're giving up 55%.
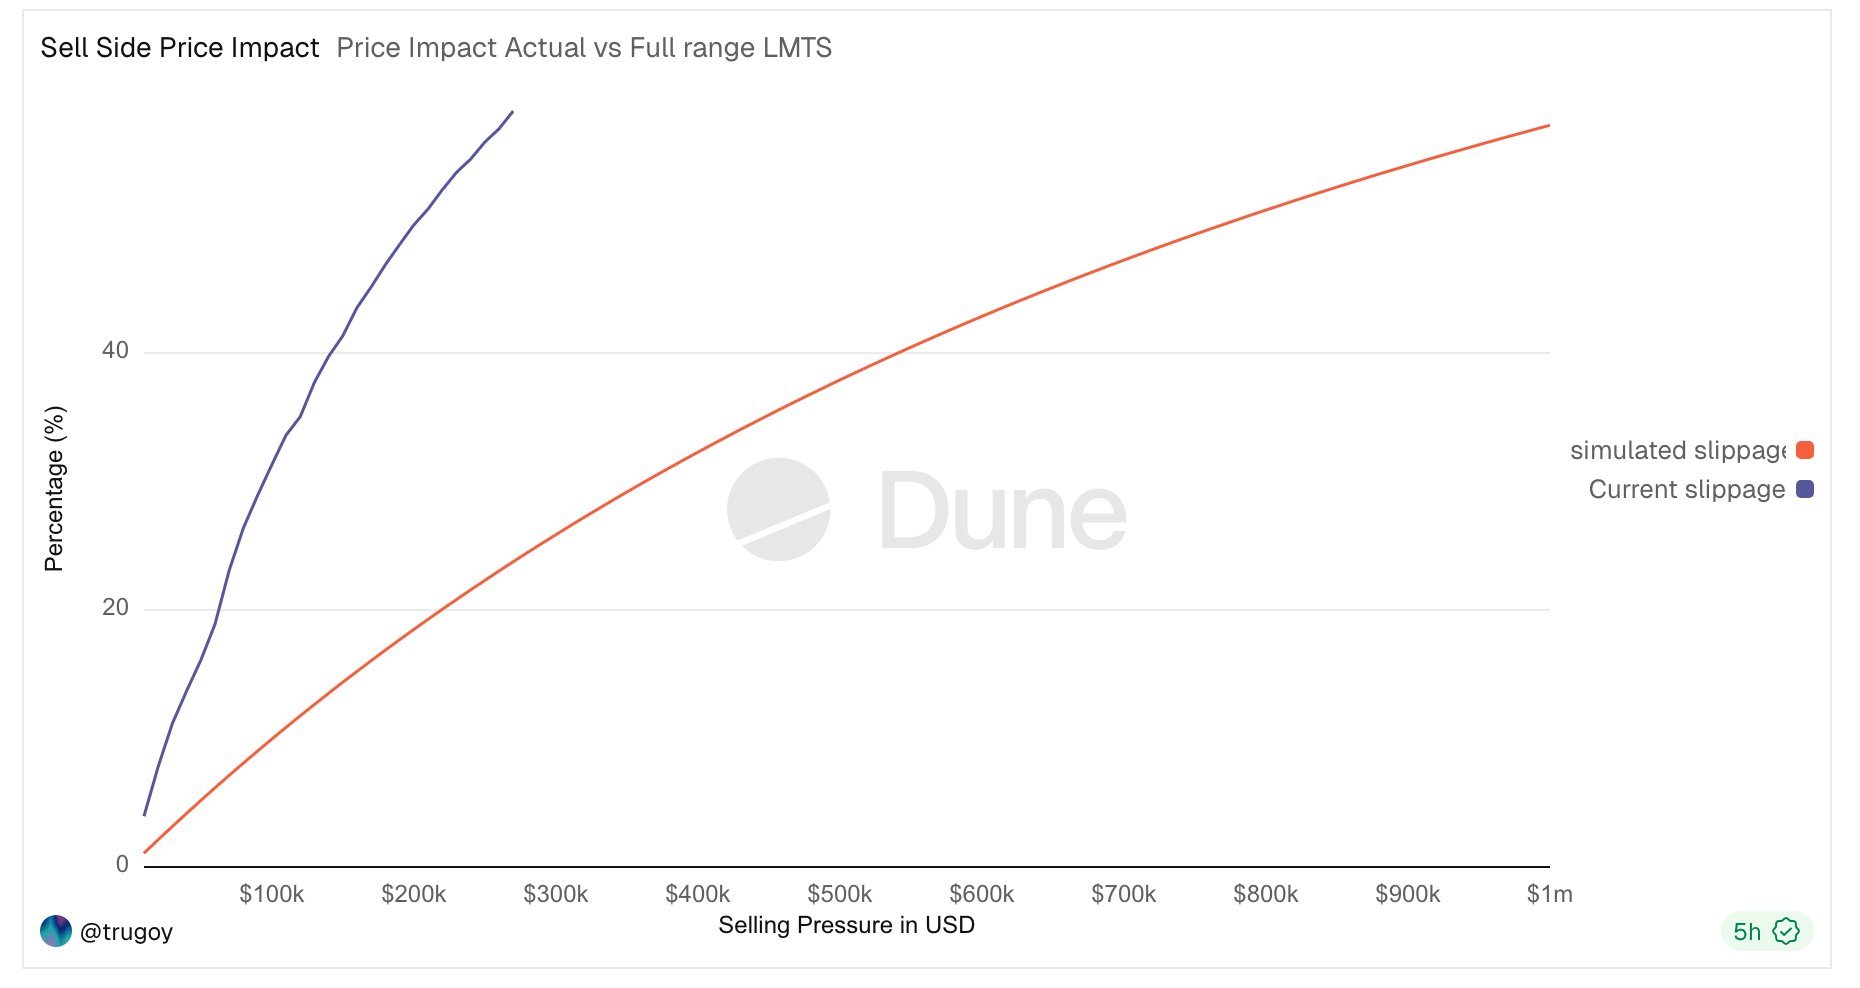
The token more than doubled. The slippage quadrupled.
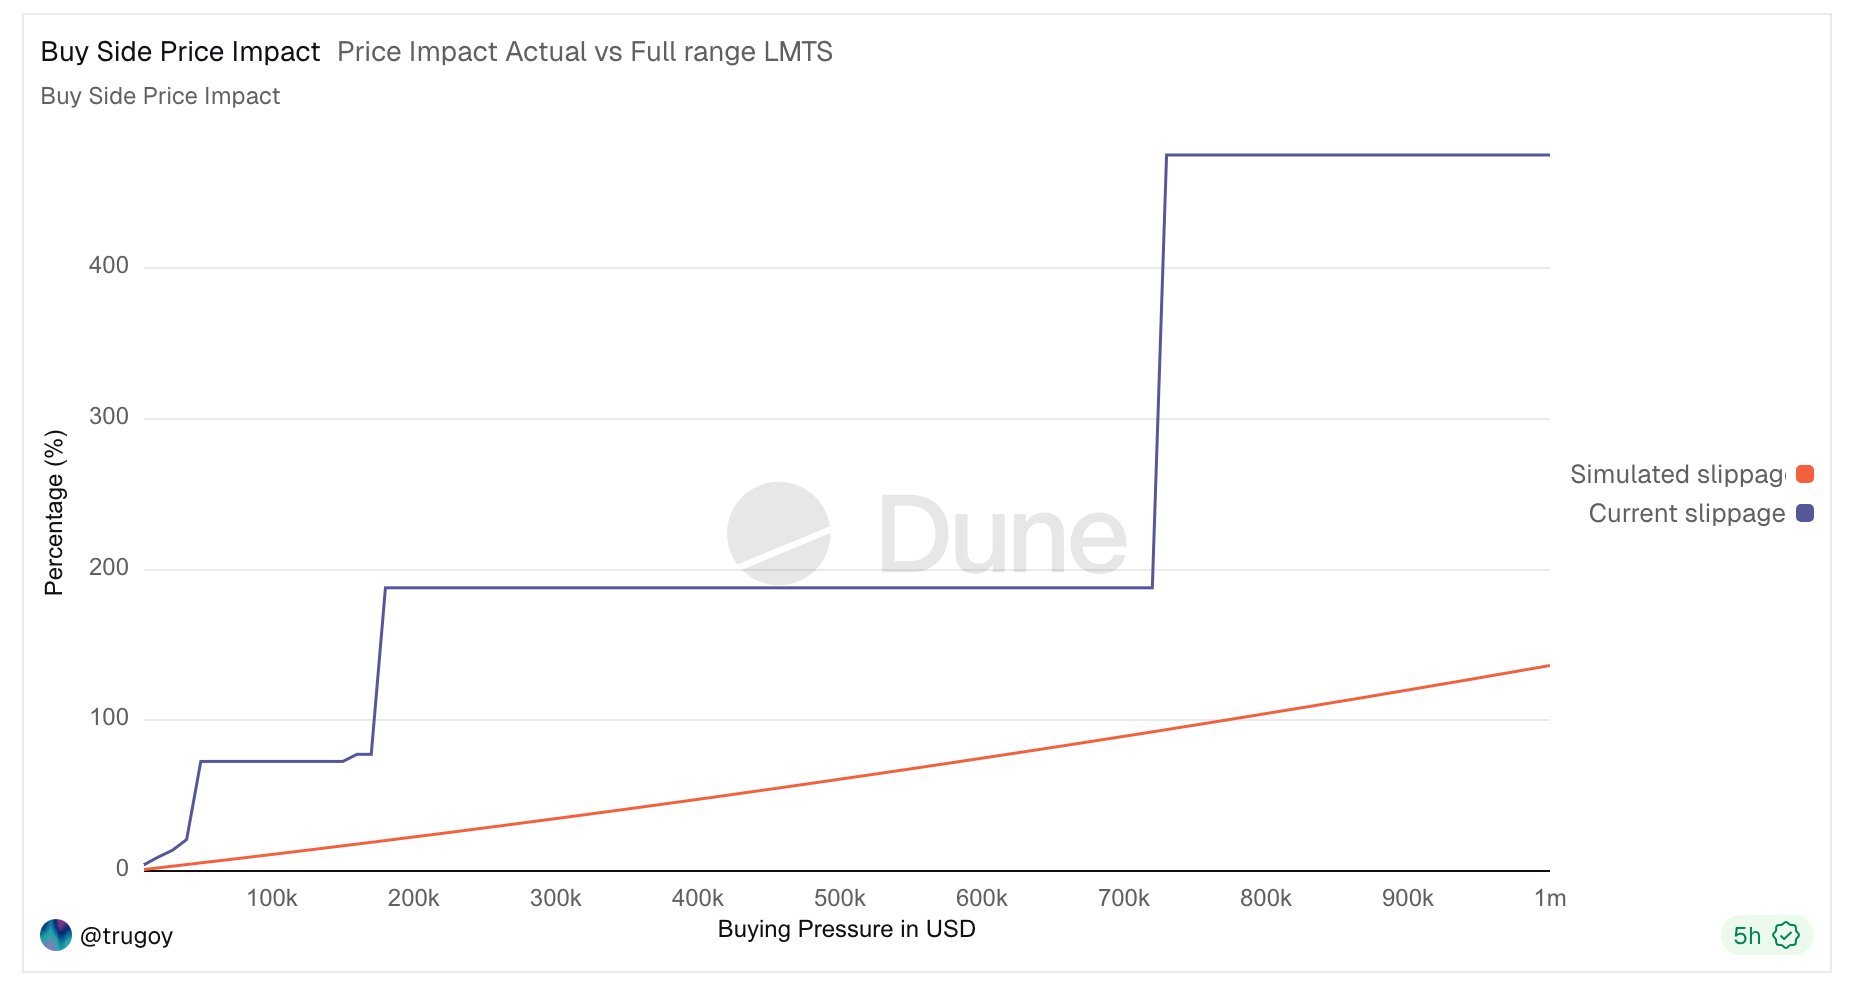
The buy side is somehow worse
$50k of buying pressure now causes ~75% slippage. And the shape of the curve tells you everything, it's not smooth, it's a staircase. Each flat section is a concentrated LP position. Each vertical jump is where that position ends and there's just... nothing behind it. A gap. At $700k of buying pressure you hit 460% slippage, which at that point isn't really a market anymore.
Where did the liquidity go?
Look at this depth chart.
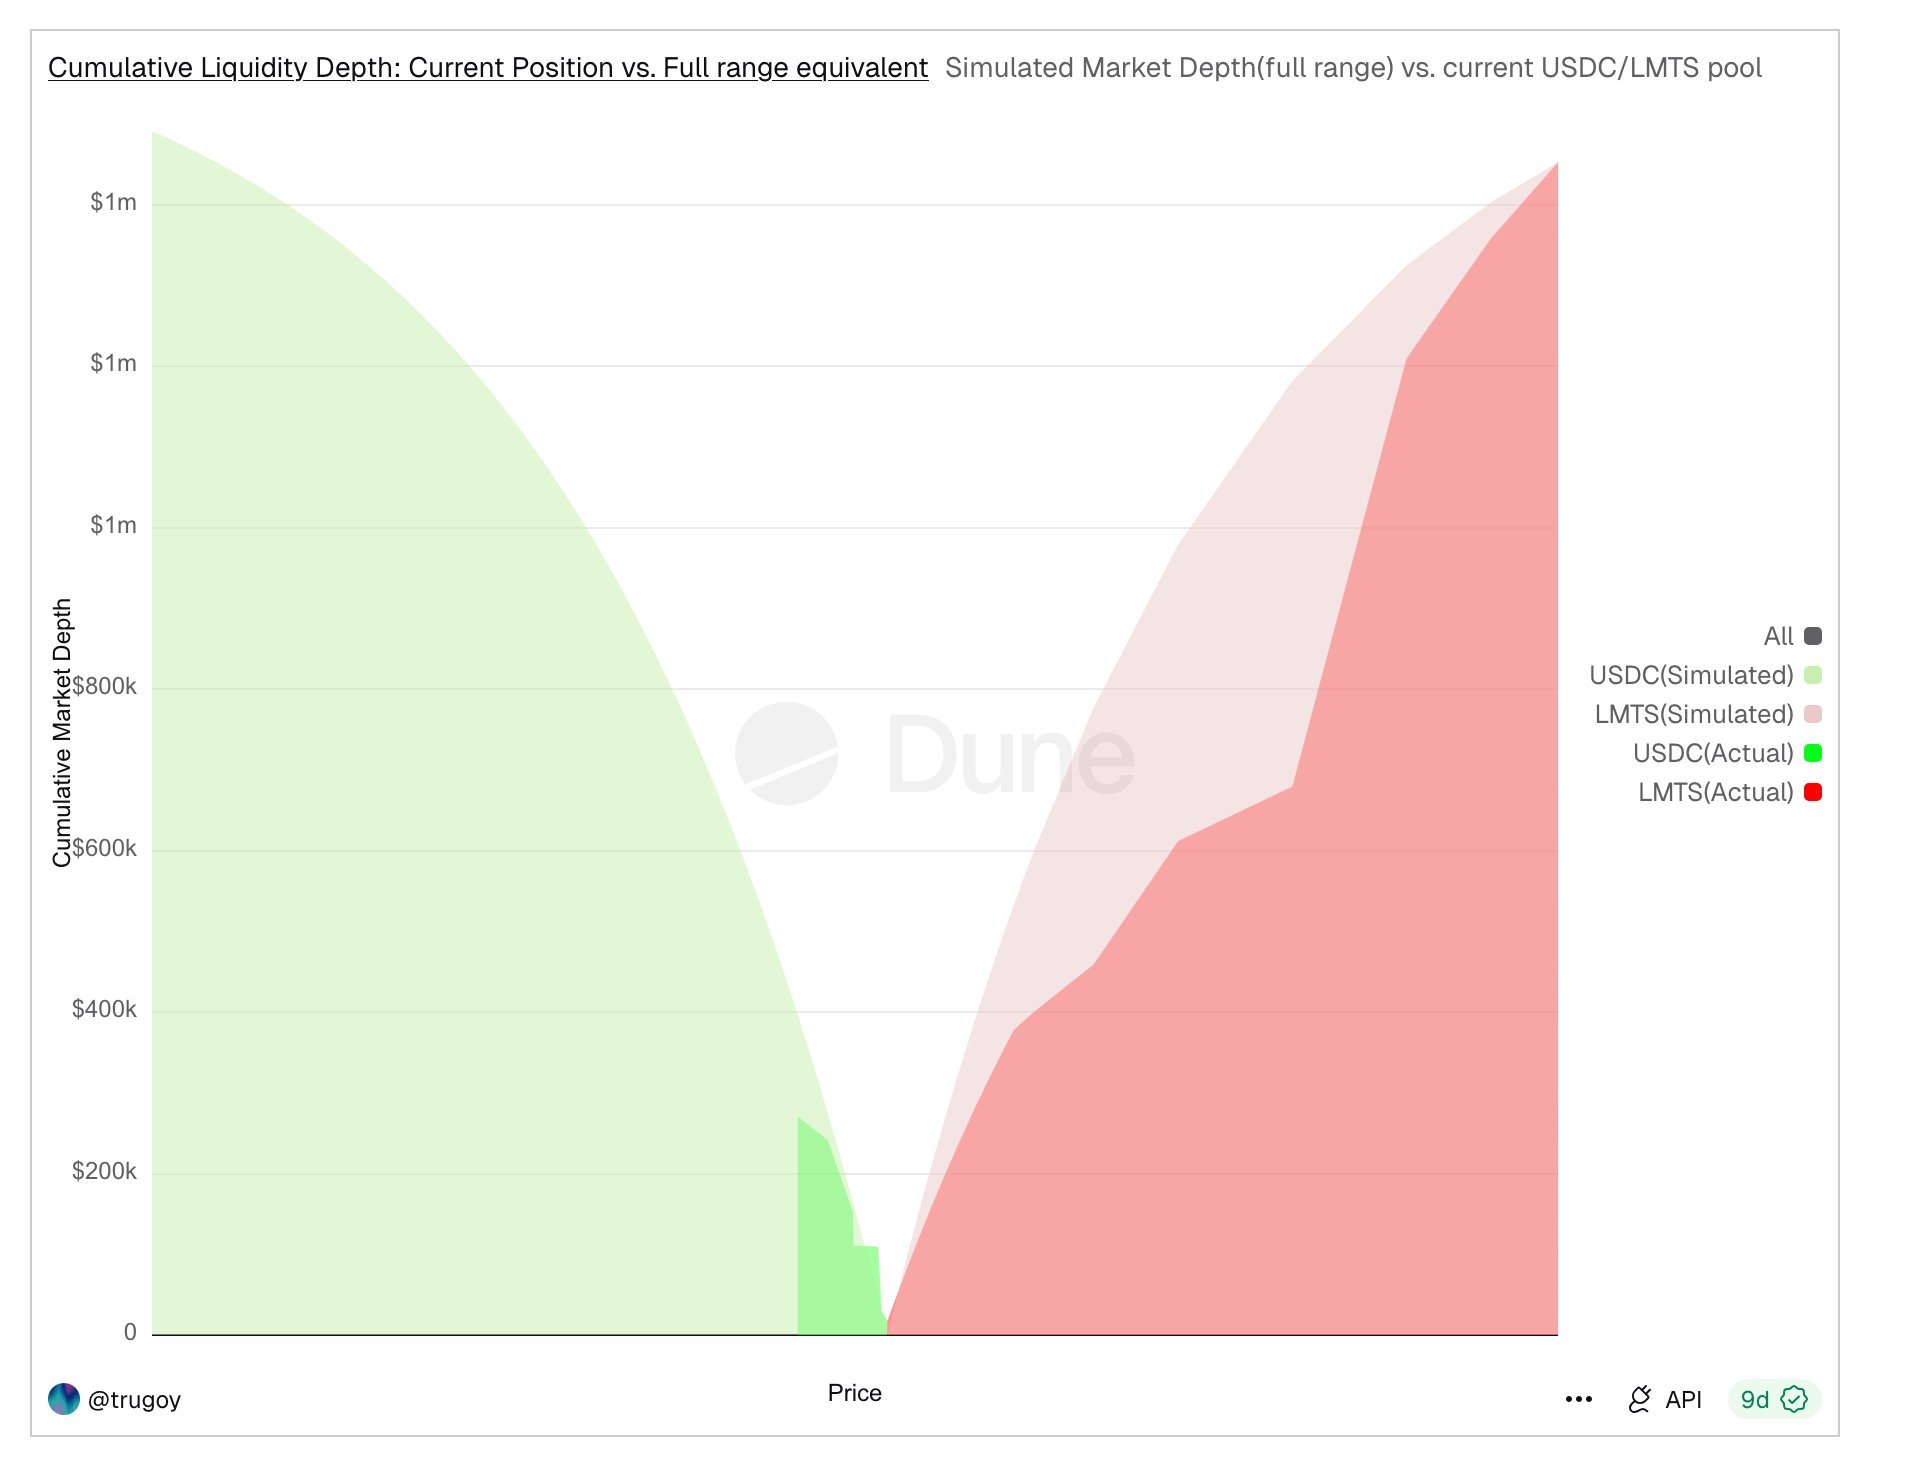
The faded green and pink show what the pool would look like if the same TVL were deployed full-range. Smooth, symmetric, scaling to $2m per side. Now look at the actual liquidity. That tiny green triangle clustered around the current price. That's all the “exit liquidity” there is.
Concentrated liquidity looks deep at the current tick. That's the trick. Move 5% in either direction and you're trading into nothing.
This isn't just LMTS
We're not trying to dunk on Limitless here. LMTS is just the pool we happened to instrument. But the dynamic is universal for anything outside the top 20 or so tokens. LPs concentrate around the current price to maximize fee capture, price moves away from their range, and they either rebalance (most don't bother) or their liquidity just sits there being useless. Meanwhile the token pumps on thin depth, creating paper gains that look great on a chart but don't survive contact with any real volume.
A caveat
This analysis covers the Uniswap V3 USDC/LMTS pool in isolation. LMTS also trades on Aerodrome, and in practice aggregators and Uniswap's own router will split trades across multiple pools, so actual execution for end users is better than what these charts show. But that's kind of the point. The fact that you need routing across multiple venues to get decent execution tells you something about how thin each individual pool really is. The underlying fragility of concentrated liquidity is the same everywhere.
What we're building
This is the problem Exchequer exists to solve. Liquidity Preferred creates deep, persistent full range liquidity, the kind that doesn't disappear when price moves and doesn't depend on LPs manually rebalancing or chasing fees.
We're turning this into a series. Drop your token in the replies and we'll run the next one on whatever gets the most engagement. Founders, if you'd rather see your numbers privately first, our DMs are open.
This analysis reflects pool conditions at the time of publication. Data sourced from Uniswap V3 on-chain. Dune dashboard.